CANDLESTICK CHART PATTERNS & MARKET STRUCTURE
Explore an extensive collection of the most popular candlestick chart patterns and market structure examples. These resources are designed to help you improve your trading strategies. Candlestick chart patterns work in tandem with market structure to provide a comprehensive view of price action. Recognizing the interplay between these elements allows traders to anticipate potential market moves and better manage risks. Explore the categories below, and share this valuable content with fellow traders to spread the knowledge for FREE!
CANDLESTICK REVERSAL PATTERNS
- Key candlestick reversal patterns to spot potential market turning points.


CHART PATTERNS
CONTINUATION AND REVERSAL
- Learn continuation and reversal chart patterns to identify breakout and trend opportunities.
MARKET STRUCTURE
ADVANCED PATTERNS
- Explore advanced market structure patterns to gain a better understanding of price behavior.

Candlestick chart patterns are a cornerstone of technical analysis, offering traders visual cues about market sentiment and potential price reversals. These patterns, such as Doji, Hammer, and Engulfing patterns, help identify critical turning points in price movements. Understanding them enables traders to make informed decisions based on historical price data.
Market structure provides the foundation for analyzing trends and ranges. By studying highs, lows, and consolidations, traders can identify key levels of support and resistance, helping to spot entry and exit points. Advanced chart patterns, like head and shoulders or double tops, further aid in predicting price movements.
Whether you’re new to trading or experienced, mastering candlestick patterns and market structure is essential. With detailed examples and insights provided here, you can refine your trading strategy and enhance your decision-making skills.
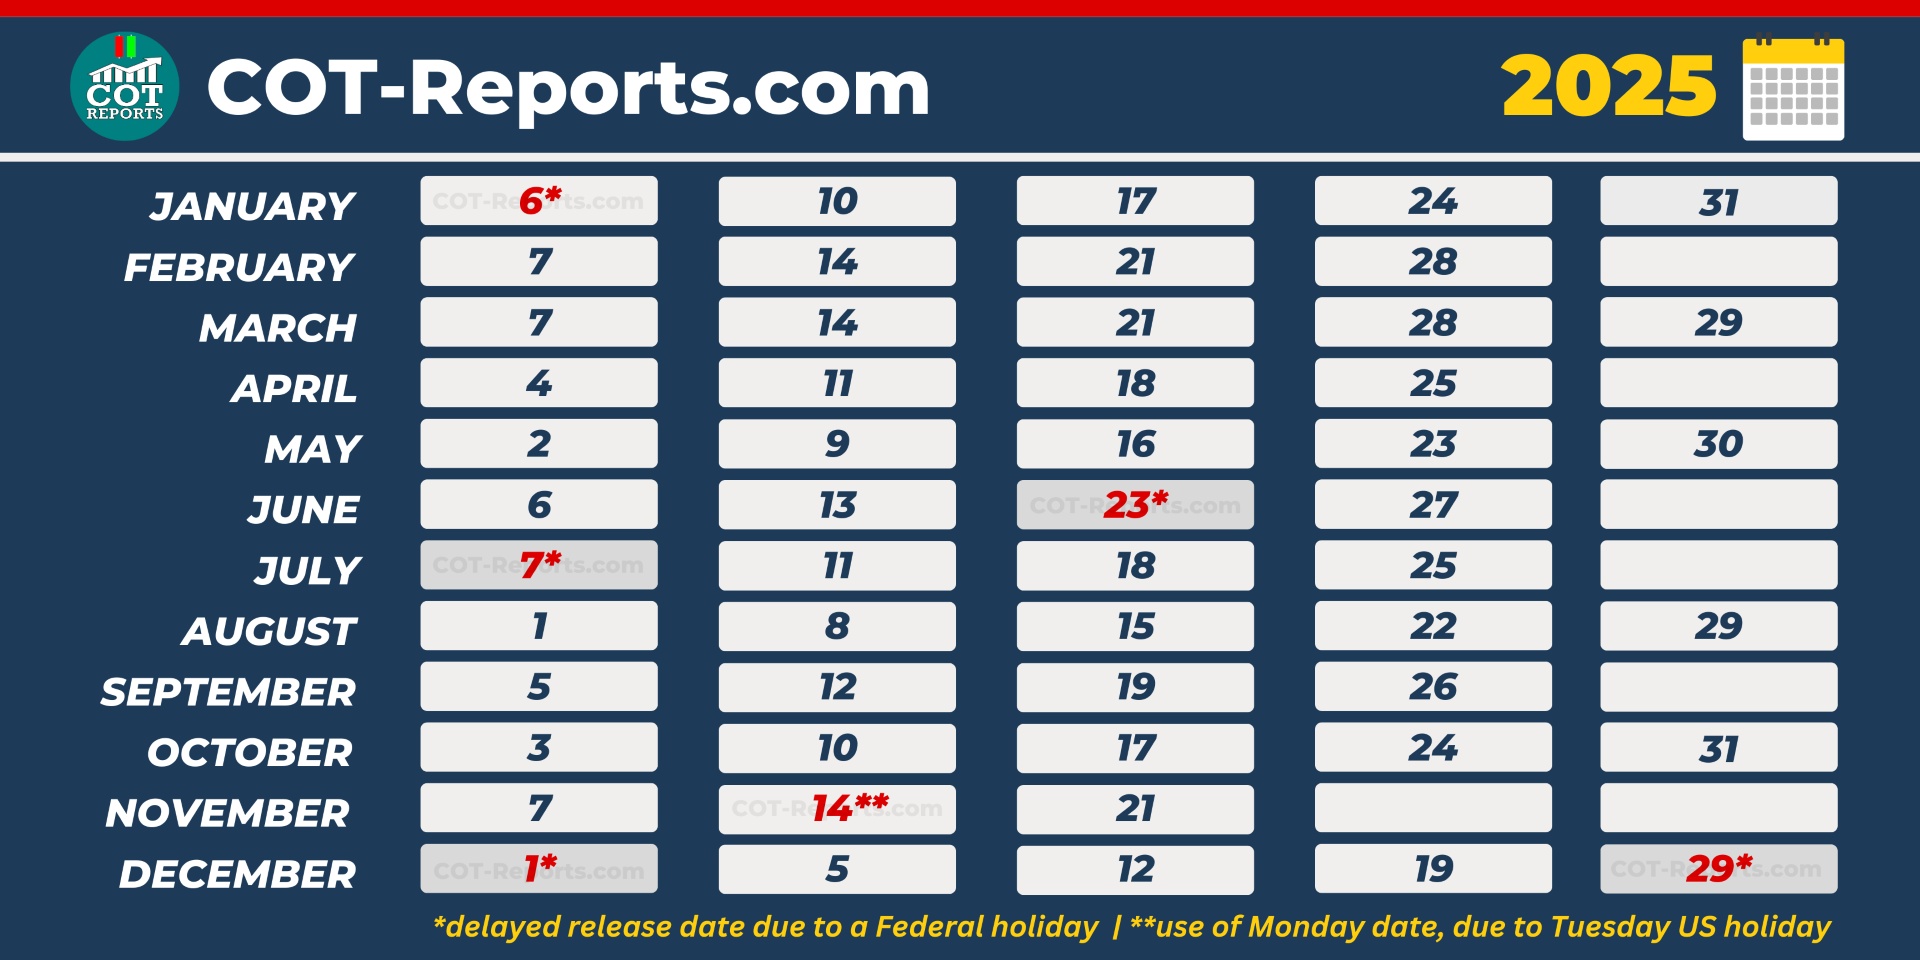
COT REPORTS 2025 RELEASE SCHEDULE