COT Reports Header Banner
Free COT Reports in clean, exclusive formats Smart tools: Trading Journal & Economic Calendar Historical COT data for Commercial, Non-Commercial & Non-Reportable positions Futures-Only reports COT Charts for instant insights Powerful COT Data Analysis Funding programs for Forex & Futures traders: one-step, two-step, or instant
COT Navigation + Schedule – Complet Izolat
Latest COT Reports: Loading… | Next Release: Loading…
Logo COT

COT Report – 2025 Weekly Release Calendar

Months COT Report Release Dates
January 6* 10 17 24 31
February 7 14 21 28
March 7 14 21 28 29
April 4 11 18 25
May 2 9 16 23 30
June 6 13 23* 27
July 7* 11 18 25
August 1 8 15 22 29
September 5 12 19 26
October 3 10 17 24 31
November 7 14** 21 29
December 1* 5 12 19 29*
Next Release Date:
September 2, 2025
Published by COT-Reports.com

JAPANESE CANDLESTICKS PATTERNS (JCP)

Here are the most used candlesticks reversal patterns.
Don’t forget to share it so anyone who loves trading can have it for FREE! 😉


CANDLESTICKS PATTERNS REVERSAL COT REPORTS

BULLISH ON THE LEFT SIDE | BEARISH ON THE RIGHT SIDE

JAPANESE CANDLESTICKS PATTERNS

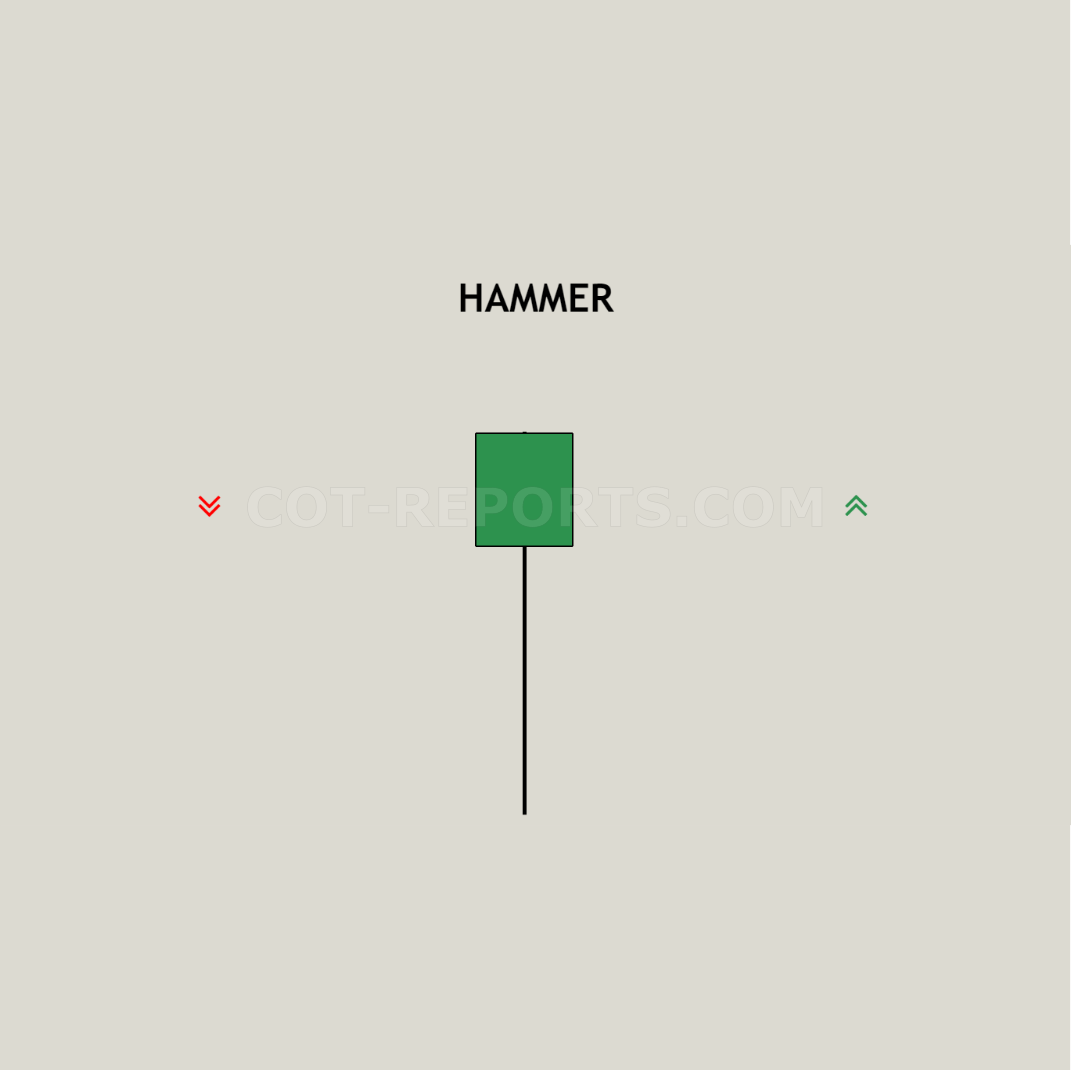
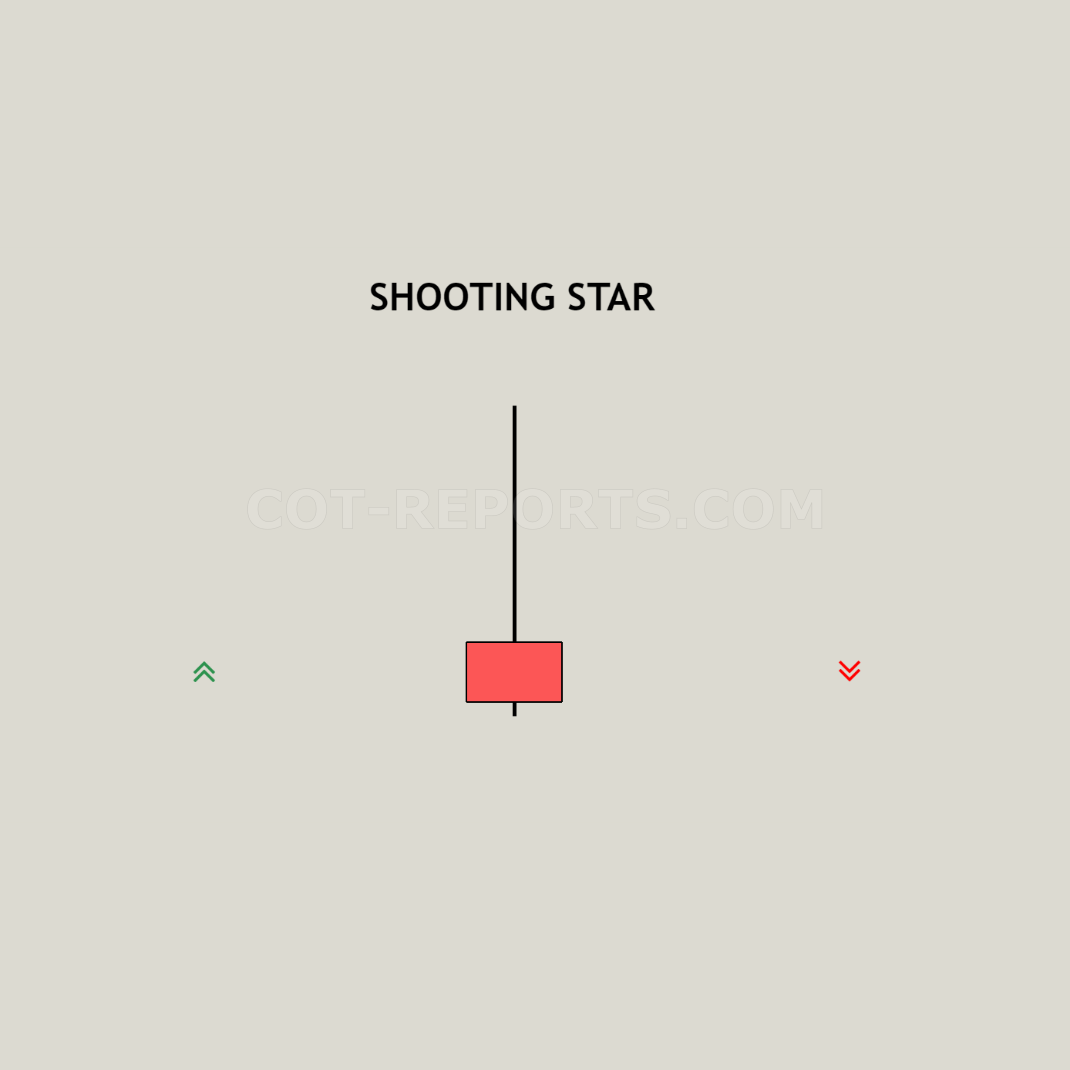
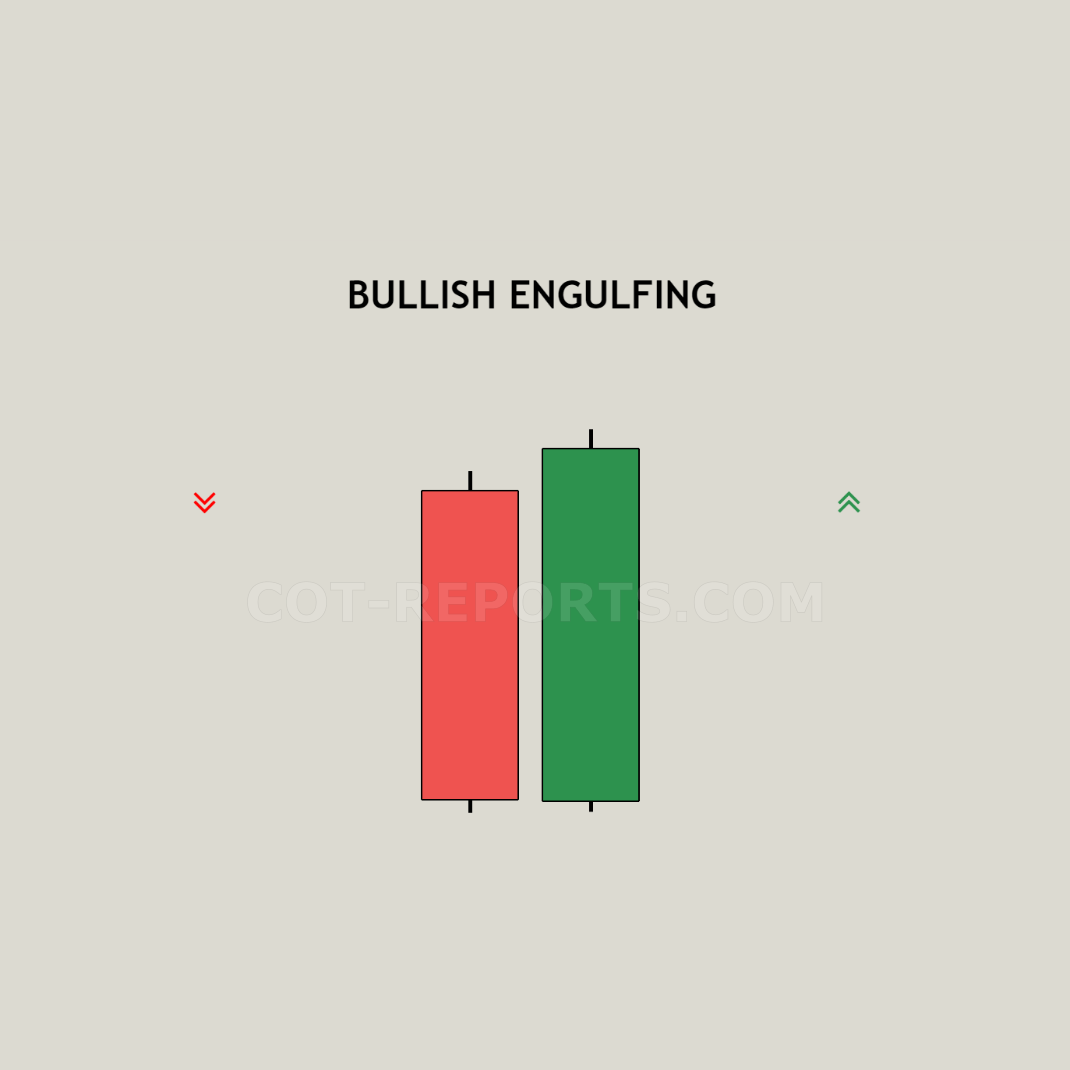
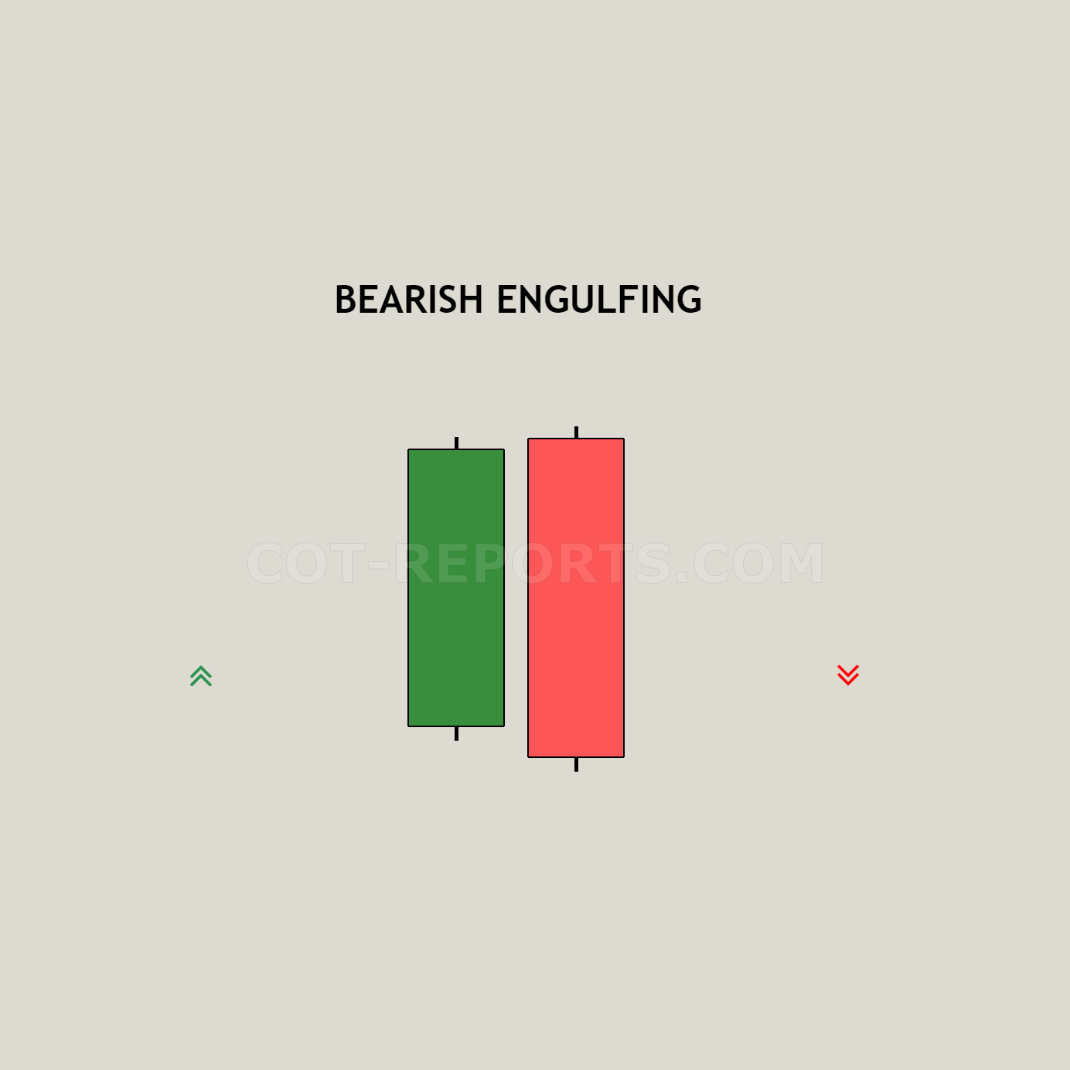
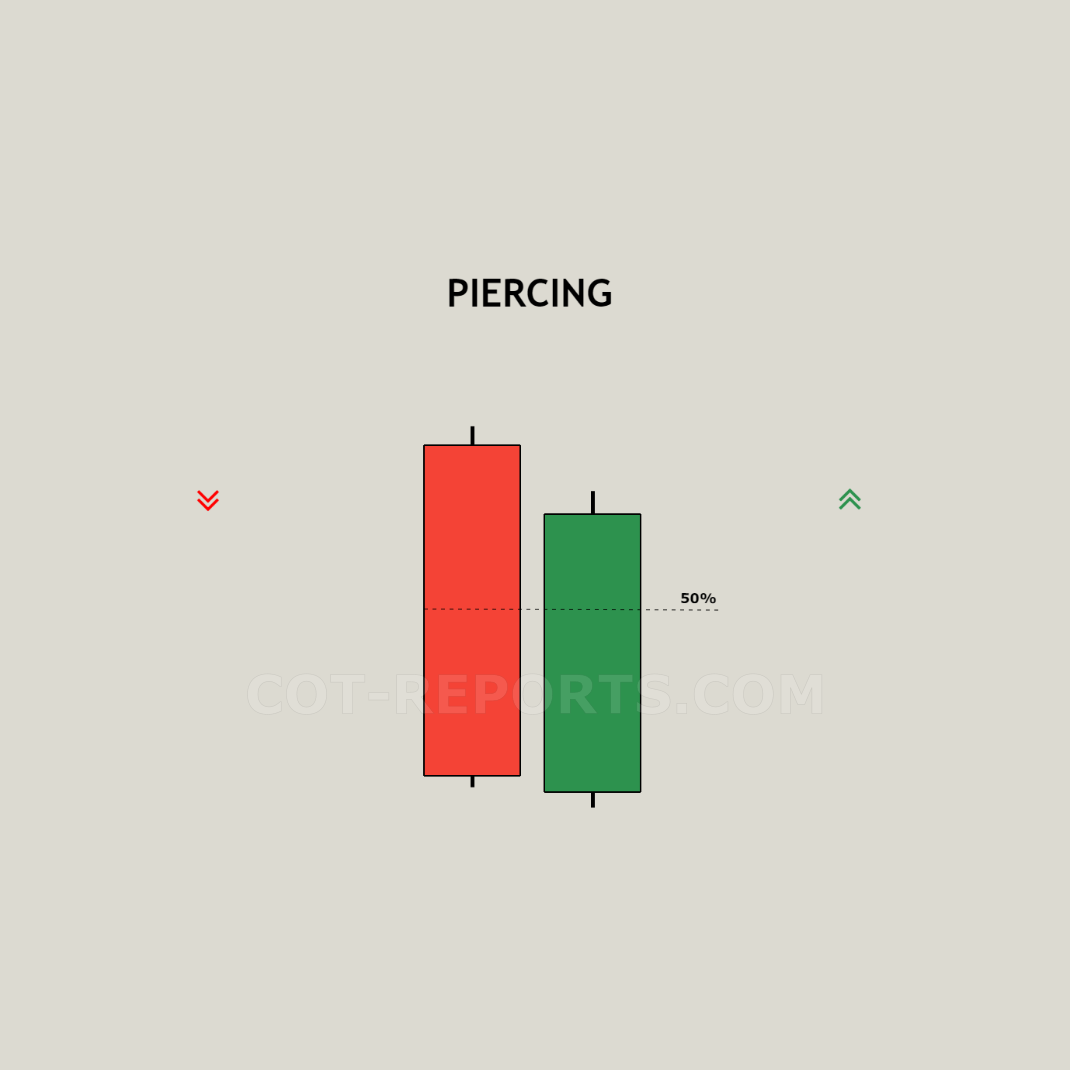
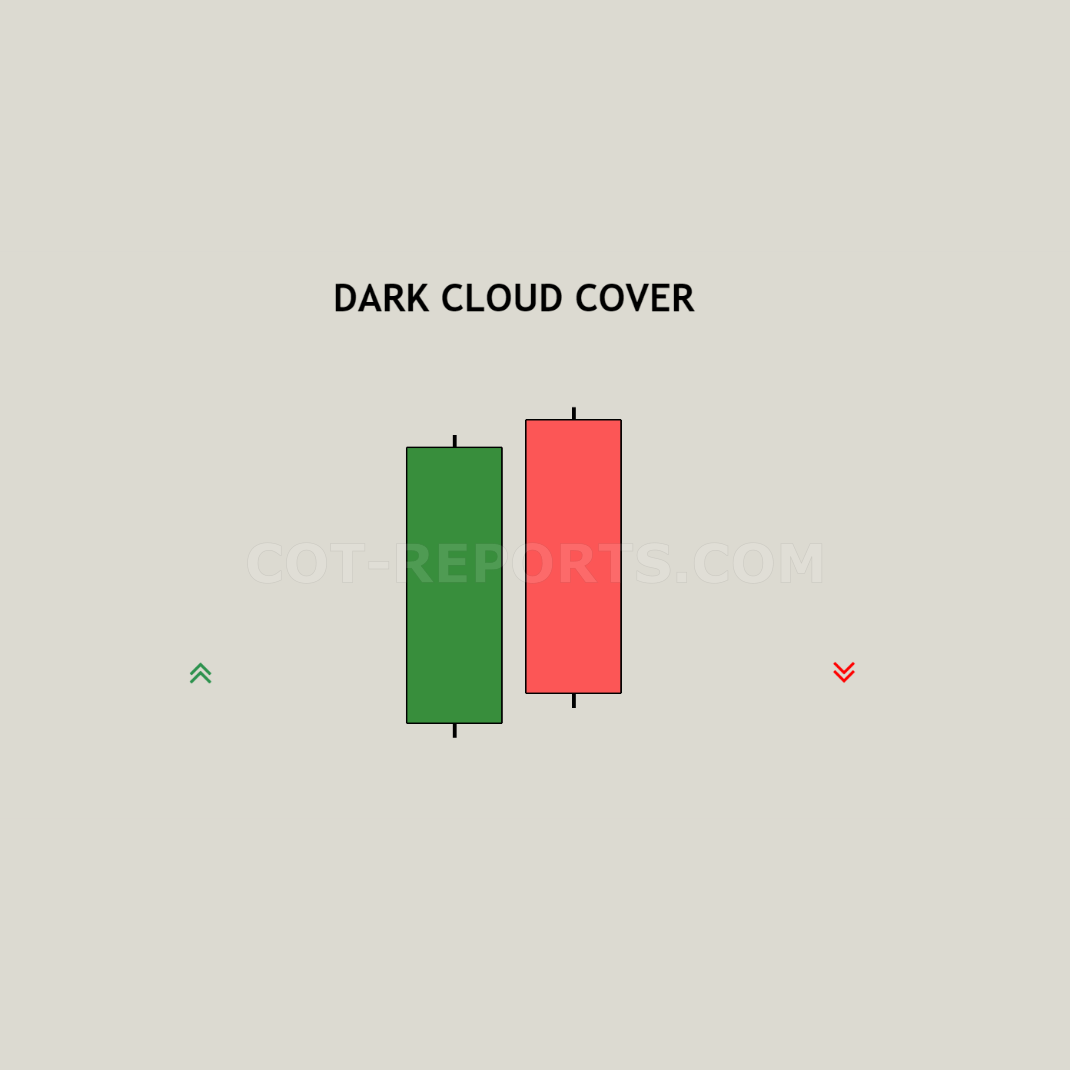
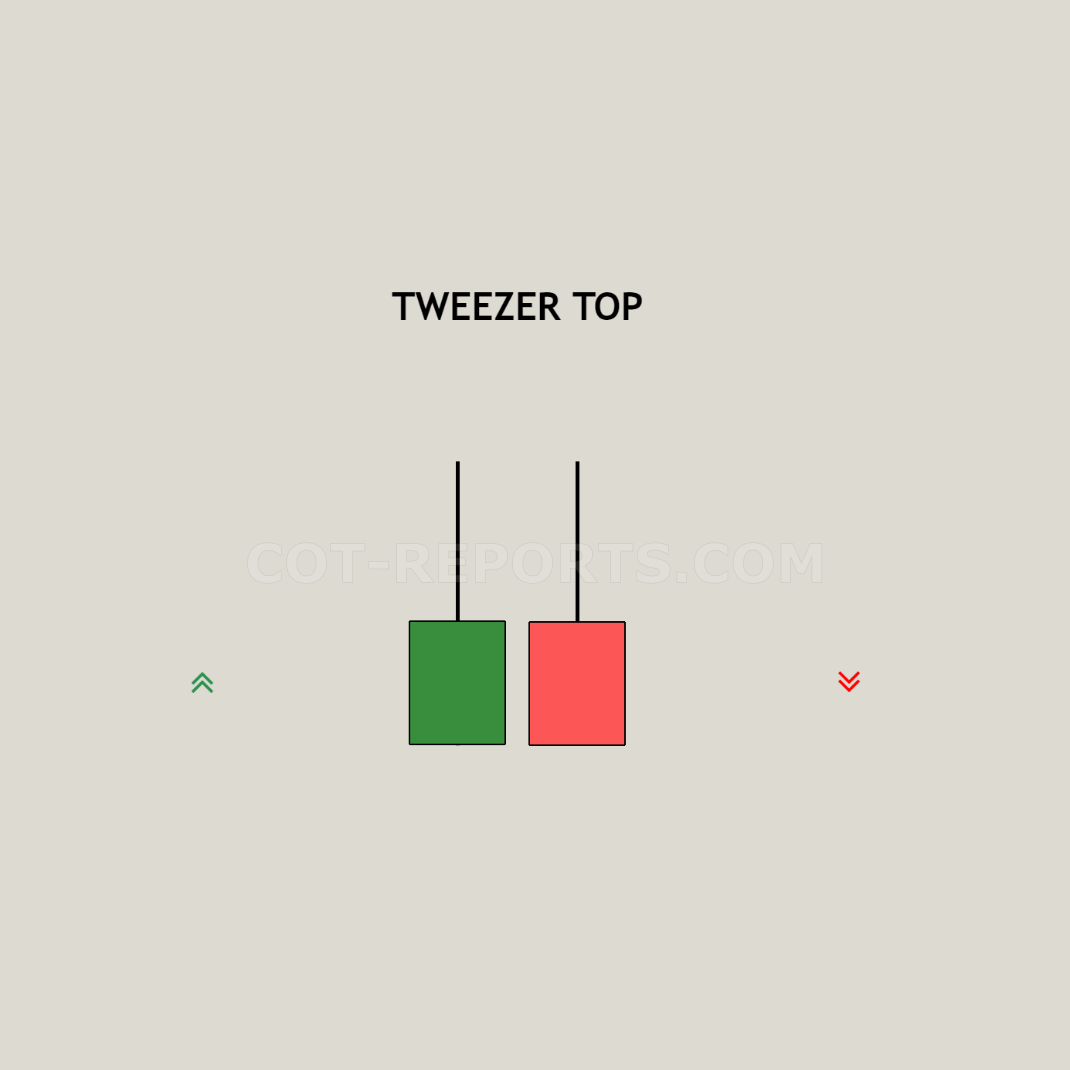
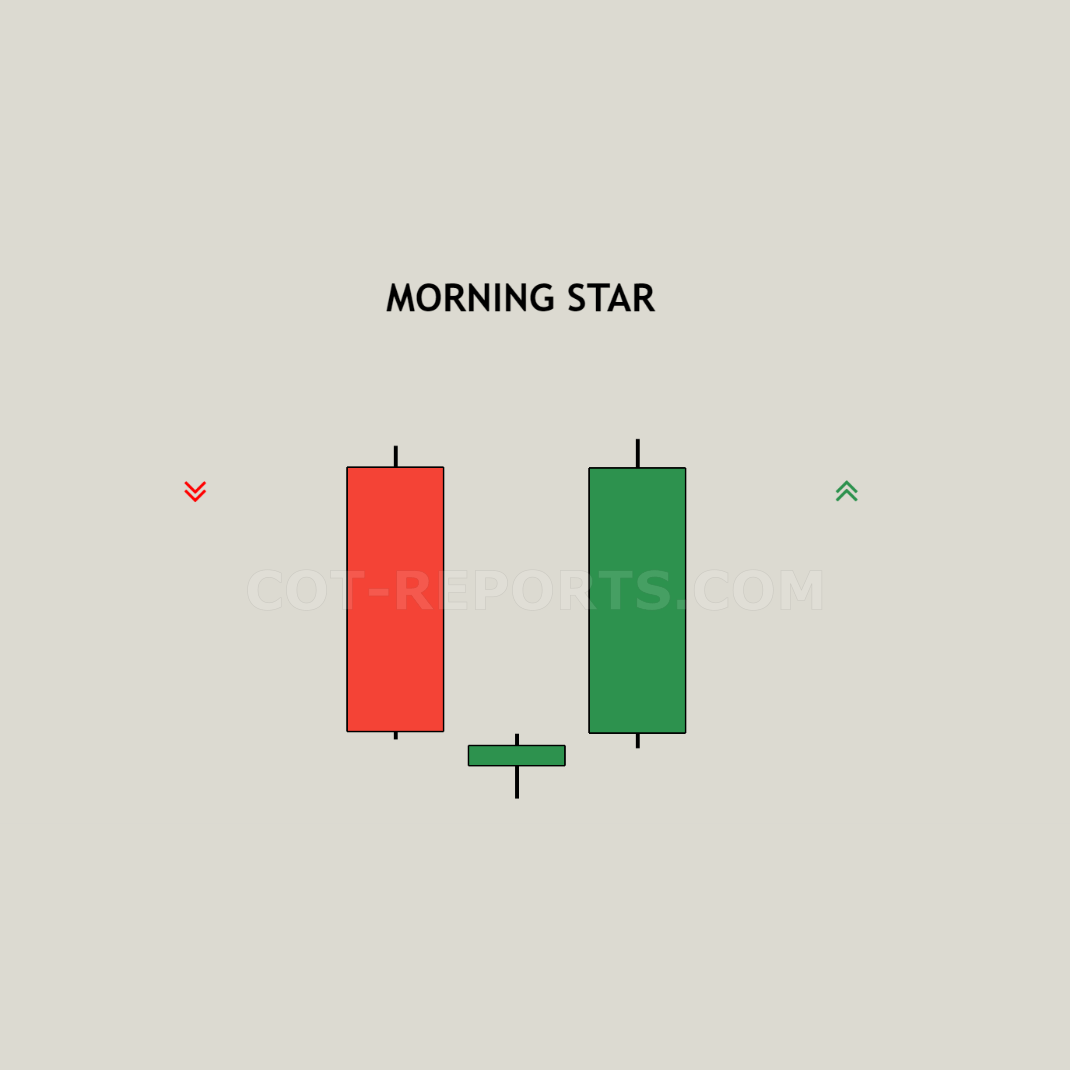
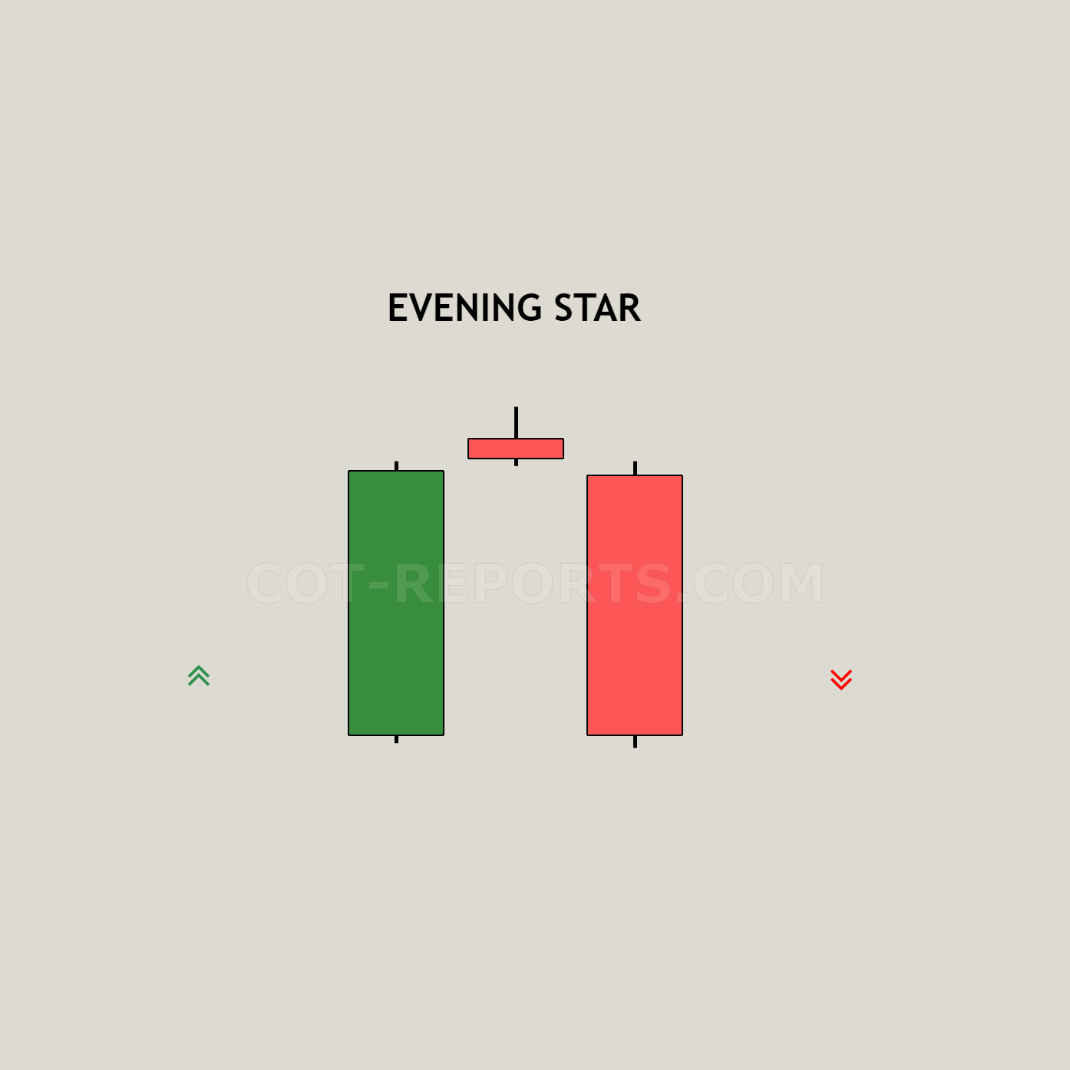
Candlestick patterns indicate a reversal in price movement and it is formed by two or three candlesticks. It doesn’t mean that a single candlestick can’t indicate a reversal.

There are two types of candlestick patterns:

  • Bullish Candlestick Patterns
  • Bearish Candlestick Patterns

The bullish candlestick patterns and the bearish candlestick patterns are used in Technical Analysis (TA) to determine a change in the trend of the market.


Happy trading! 🙂 Was it helpful? Buy Me a Coffee HERE

Hey there! If you find my trading content helpful, please consider supporting COT-Reports.com by Buying Me A Coffee. Your support helps me keep this website free of ads, so I can continue to share my content with traders like you. Thanks for your support! 🙂

SUPPORT COT-REPORTS.COM
SUPPORT COT REPORT

Trade any markets at your own risk! I am not responsible for any loss. View Risk Warning and Disclaimer.